
Spargine is a collection of open-source assemblies and NuGet packages designed for .NET 10, which I have been developing and maintaining since the release of .NET Framework 2. These assemblies are not only a core part of my projects but are also actively deployed in production environments across several companies I collaborate with.
Get Spargine
You can access the source code and NuGet packages here:
- GitHub: Spargine 10
- NuGet: dotNetDaveNuGet
Introducing the PerformanceStopWatch
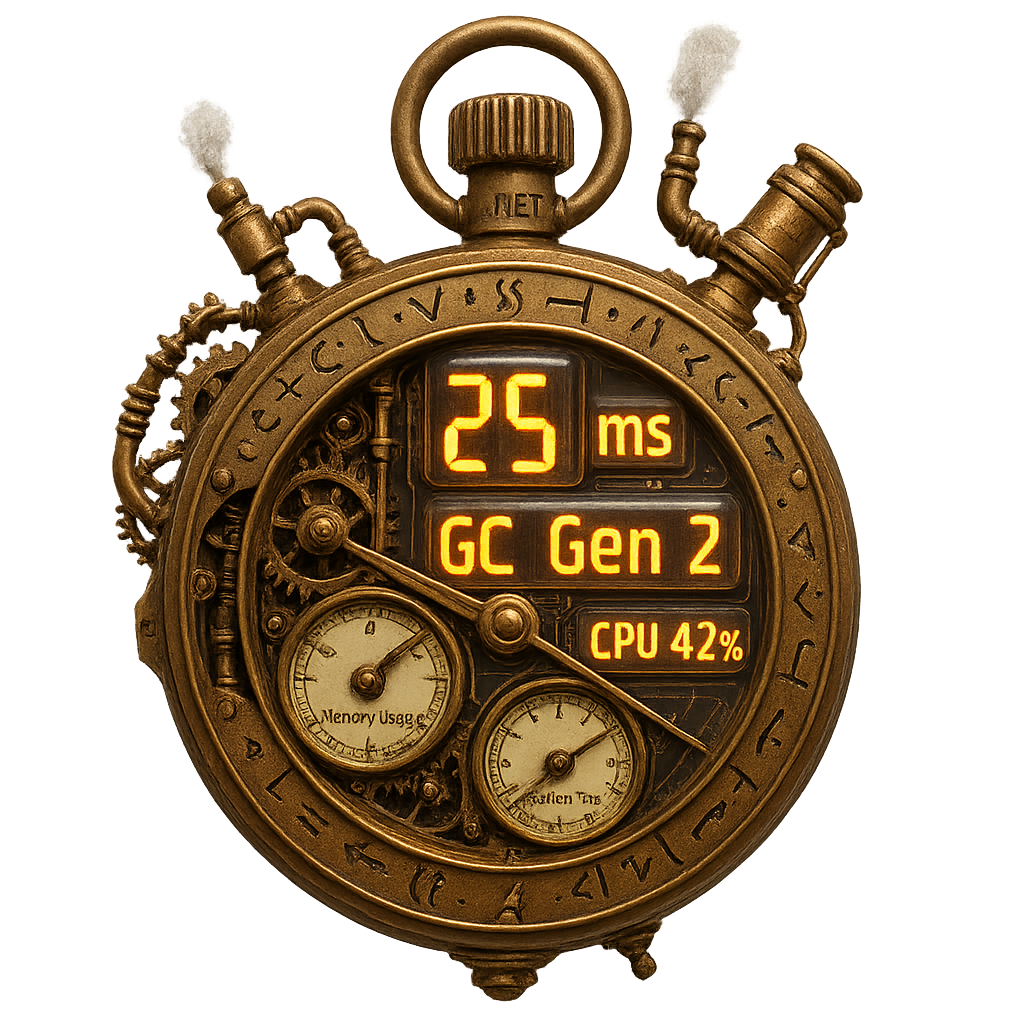
Are you using the Stopwatch type in .NET to measure execution time for testing or performance analysis? While the Stopwatch class is certainly useful, I’ve found that it can be made even more powerful with a few additional features. That’s why I developed the PerformanceStopwatch, which is available in the DotNetTips.Spargine.Core assembly.
This enhanced type takes performance measurement and diagnostics to the next level, offering more comprehensive tools for logging and tracking. One of the standout features in this version of PerformanceStopwatch is the ability to create laps, allowing you to segment your timing into smaller intervals. Additionally, it includes the option to set a threshold—if the elapsed time exceeds this threshold, an event is triggered. This event can be used for various purposes, including sending telemetry data to Application Insights, making it even easier to track how long operations take in real-time.
Whether you’re working on performance optimization, testing, or diagnostics, the PerformanceStopwatch provides a much more detailed and streamlined approach to timing your operations.
Constructors
- PerformanceStopwatch()
Initializes a new instance with an empty title. - PerformanceStopwatch(string title)
Initializes a new instance with a specified title.
Methods
- AddDiagnosticEntry(string message)
Adds a diagnostic entry with the specified message and the current elapsed time. - ClearDiagnostics()
Clears all logged diagnostic messages. - ClearLaps()
Clears all the recorded lap times. - CreateEntry(string message, TimeSpan result)
Creates a structured diagnostic entry. - ExportToJson()
Serializes stopwatch data to JSON, including laps and diagnostics. - GetDiagnosticMessages()
Retrieves all diagnostic messages recorded during the stopwatch’s operation. - GetElapsedTime()
Calculates the elapsed time since a starting high-resolution timestamp using the system performance counter. - GetElapsedTime(long startingTimestamp, long endingTimestamp)
Calculates the elapsed time between two high-resolution timestamps using the system performance counter. - GetLaps()
Gets a read-only list of all recorded lap times. - GetSummaryReport()
Returns a detailed summary report including laps and diagnostics. - GetTimeStamp()
Gets the current high-resolution timestamp from the system’s performance counter. - GetTotalTimeString()
Gets the current elapsed time formatted as a human-readable string with milliseconds precision. - LogMessage(ILogger logger, string message)
Logs a custom message and the current elapsed time using the provided logger. - RecordLap()
Records a lap (checkpoint) using the current elapsed time. - StartNew(string title)
Starts a new instance with an optional title. - StartNewWithAlertThreshold(TimeSpan? alertThreshold, string title)
Starts a new instance of the PerformanceStopwatch with a specified alert threshold and optional title. - StartNewWithTelemetry(TelemetryClient telemetry, string operationName, TimeSpan? alertThreshold, string message, IDictionary<string, string>? properties)
Starts a new instance of PerformanceStopwatch with telemetry tracking enabled. - StopIfThresholdExceeded()
Stops the stopwatch if the elapsed time exceeds the configured threshold. - StopReset()
- Stops and resets the stopwatch, returning the elapsed time. Fires telemetry and threshold events if configured.
- StopReset(ILogger logger, string message)
Stops and resets the stopwatch, logs a message, and returns the elapsed time. - StopRestart()
Stops and restarts the stopwatch, triggering threshold alerts if applicable. - StopRestart(ILogger logger, string message)
Stops and restarts the stopwatch, logs a message, and returns the elapsed time. - ToString()
Returns a detailed summary report of the stopwatch, including laps and diagnostics, as a string. - TrackTelemetry(TelemetryClient telemetry, string operationName, string message, IDictionary<string, string>? properties)
Tracks telemetry data for the current stopwatch instance using Application Insights. - WithTelemetry(TelemetryClient telemetry, string operationName, string? message, IDictionary<string, string>? properties)
Configures telemetry tracking for this stopwatch instance using Application Insights.
Properties
- AlertThreshold
Gets the threshold for performance alerts. - Diagnostics
Returns the logged messages as a read-only collection. - IsThresholdExceeded
Gets a value indicating whether the elapsed time has exceeded the configured threshold. - Title
Retrieves the title of the PerformanceStopwatch.
Events
- EventHandler<ElapsedEventArgs>? ResetCompleted
The event is triggered when the stopwatch is reset. - EventHandler<ElapsedEventArgs>? StopCompleted
The event is triggered when the stopwatch is stopped. - EventHandler<ElapsedEventArgs>? ThresholdExceeded
The event is triggered when the elapsed time exceeds the threshold.
Real-World Use Cases
I regularly use PerformanceStopwatch in my projects, including my work and Spargine, as well as in the Spargine Dev Tool. Below are a couple of practical examples.
Measuring Performance of CopyTo
var psw = PerformanceStopwatch.StartNew();

_ = tempFile.CopyTo(newFileName.FullName, overwrite: true);

var perf = psw.StopReset();

this.OnProcessed(new FileProgressEventArgs
{
    Name = tempFile.FullName,
    Message = tempFile.Name,
    ProgressState = FileProgressState.Copied,
    Size = tempFile.Length,
    SpeedInMilliseconds = perf.TotalMilliseconds,
});
Deleting Folders with FileProcessor
var sw = PerformanceStopwatch.StartNew(nameof(this.DeleteFolders));

var directoriesDeletedCount = this._fileProcessor.DeleteFolders(folders);

ConsoleHelper.WriteLine(string.Format(
    CultureInfo.CurrentUICulture,
    _userMessageDeletionOfFoldersTookSecondsFormat,
    directoriesDeletedCount,
    sw.StopReset().TotalSeconds));
Configuring and Using Telemetry
var psw = PerformanceStopwatch.StartNewWithTelemetry(telemetry: Program.TelemetryClient, operationName: nameof(FileCleanerProcessor), message: nameof(this.DeleteFiles));

psw.AddDiagnosticEntry($"Page Size: {this.PageSize}");

_ = Parallel.ForEach(files.Page(this.PageSize), options, (page) => _ = this._fileProcessor.DeleteFiles(page));

var speed = psw.StopReset();

Program.Logger?.Information(psw.ToString());
Json Example
{
  "Title": "ExportToJsonTest",
  "ElapsedTimeMs": 518.3743,
  "Laps": [
    "00:00:00.5071919"
  ],
  "Diagnostics": [
    {
      "Timestamp": "2026-01-09T16:09:25.166055+00:00",
      "Message": "ExportToJsonTest: Test diagnostic entry",
      "ElapsedMs": 510.6587
    }
  ]
}
Summary
The PerformanceStopwatch in Spargine is an advanced tool that significantly enhances your ability to measure and analyze performance in .NET applications. By building upon the base functionality of the Stopwatch class, it adds powerful features for tracking, diagnostics, and telemetry. Key features include:
- Lap Tracking: Segment your performance measurements into smaller, manageable intervals for more granular insights.
- Alert Thresholds: Automatically trigger events when elapsed time exceeds a predefined threshold, perfect for real-time monitoring and logging.
- Telemetry Integration: Seamlessly send performance data to Application Insights, making it easier to track and diagnose performance issues in production environments.
With methods like ExportToJson, GetSummaryReport, and RecordLap, PerformanceStopwatch allows you to gain comprehensive visibility into your application’s performance. Whether you’re logging custom diagnostic messages, tracking operation times with telemetry, or simply measuring elapsed time, the PerformanceStopwatch makes it easy to optimize your .NET applications.
By utilizing features such as TrackTelemetry and StopIfThresholdExceeded, developers can ensure they are not only monitoring performance but also responding to issues in real-time, improving both application performance and reliability.
This tool is indispensable for anyone aiming to take performance measurement to the next level in their .NET projects, helping developers optimize and debug with confidence.
Get Involved!
The success of open-source projects like Spargine relies on community contributions. If you find these updates useful or have ideas for further improvements, I encourage you to contribute by:
- Submitting pull requests
- Reporting issues
- Suggesting new features
Your input is invaluable in making Spargine an even more powerful tool for the .NET community.
If you are interested in contributing or have any questions, feel free to contact me via email at dotnetdave@live.com. Your support and collaboration are greatly appreciated!
Thank you, and happy coding!
Pick up any books by David McCarter by going to Amazon.com: http://bit.ly/RockYourCodeBooks
Make a one-time donation
Make a monthly donation
Make a yearly donation
Choose an amount
Or enter a custom amount
Your contribution is appreciated.
Your contribution is appreciated.
Your contribution is appreciated.
DonateDonate monthlyDonate yearlyIf you liked this article, please buy David a cup of Coffee by going here: https://www.buymeacoffee.com/dotnetdave
© The information in this article is copywritten and cannot be preproduced in any way without express permission from David McCarter.
Discover more from dotNetTips.com
Subscribe to get the latest posts sent to your email.
