I have stated many, many times, “Performance affects memory and memory affects performance”. None of the code analysis tools I’ve written about will find every issue when it comes to memory and performance issue. The only way to find the rest is by using a memory profiler tool on running code near to production machine setup as possible.
I’ve tried all the major tools on the market and the one that I like the best is .NET Memory Profiler from SciTech Software. This tool will profile any .NET process including ASP.NET, Windows Store App, remote processes and it supports .NET Core.
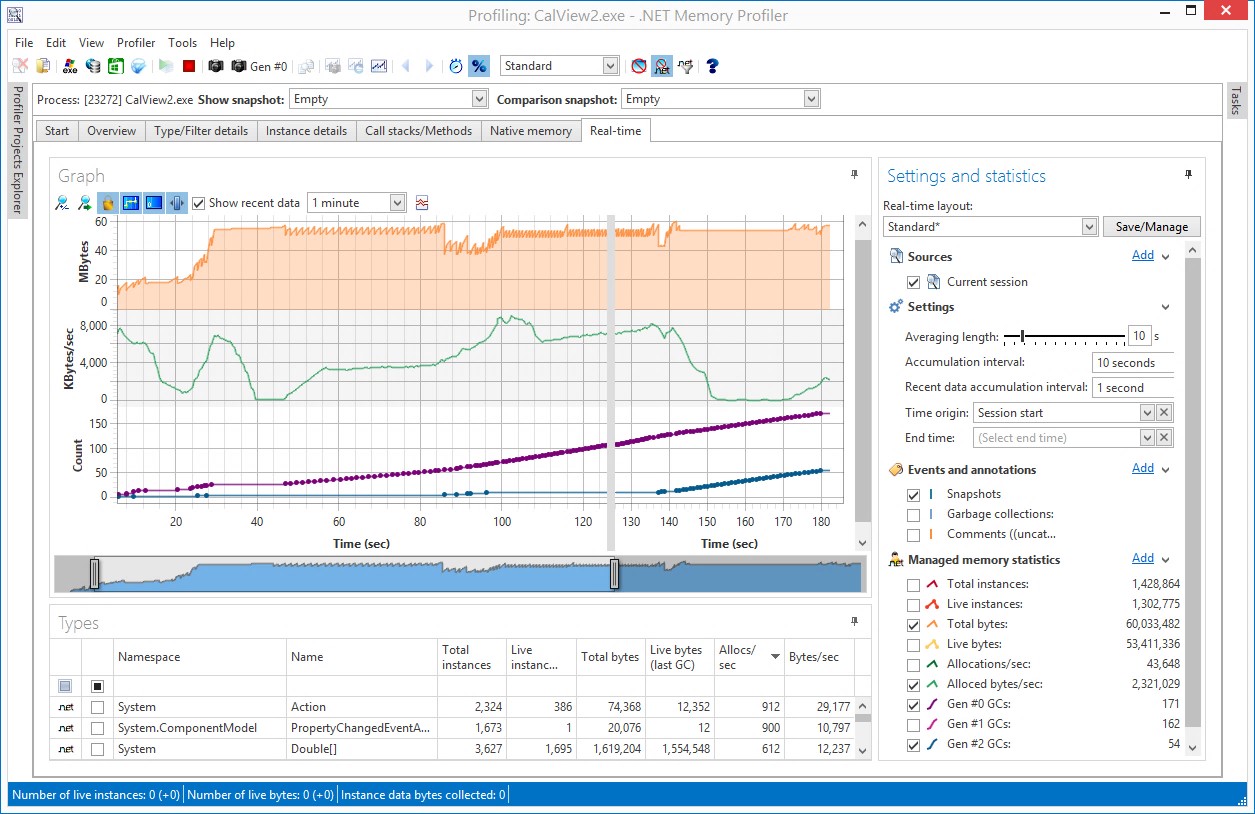
When running a profile, you can view analysis gathering live with the view below.
After the profile is complete, the overview of the issues is shown.
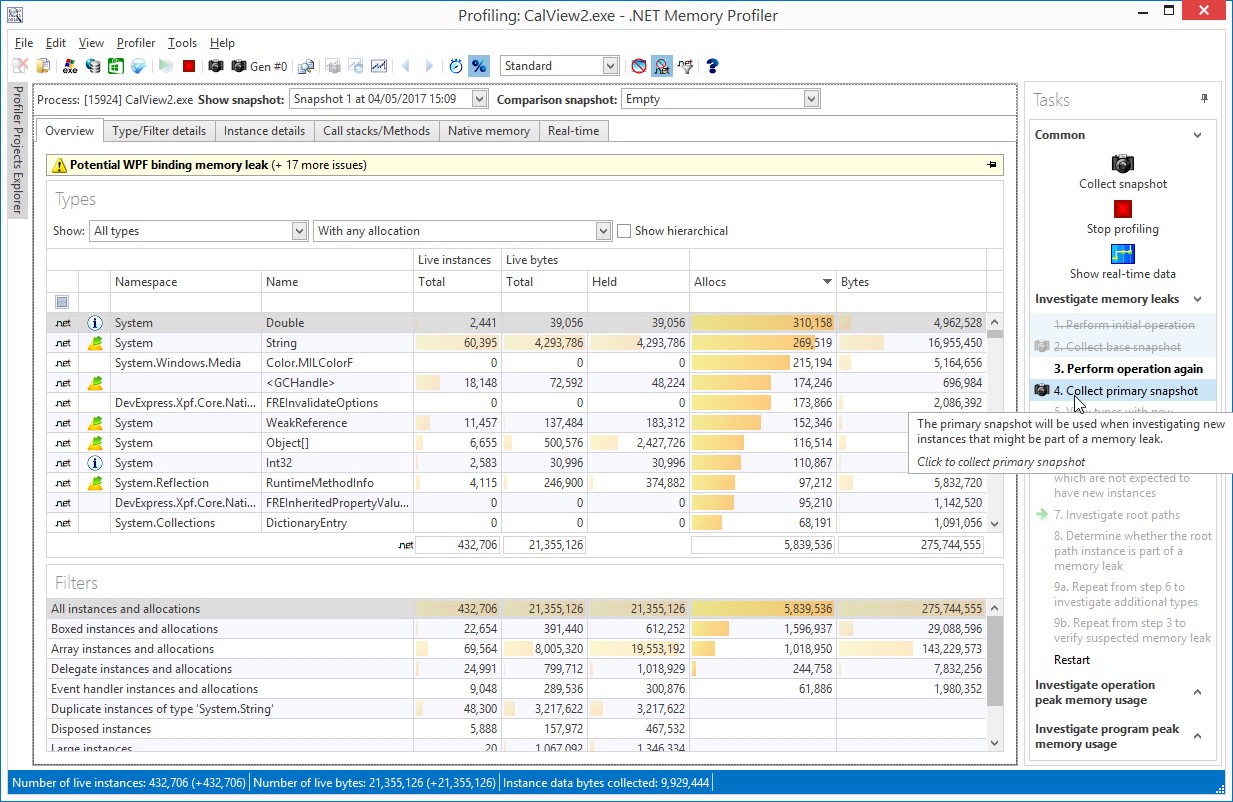
Here is where the analysis begins. For most of the issues, it can be drilled into the Filter Details view.
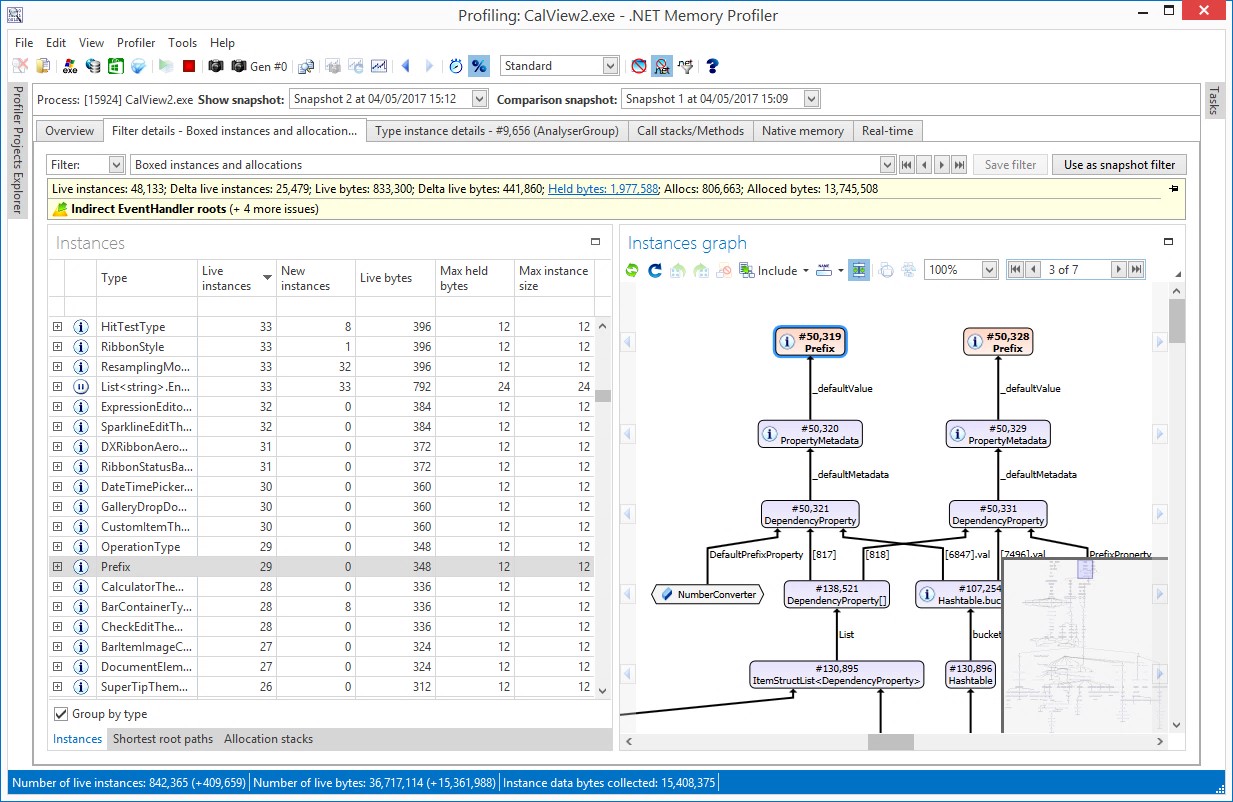
You can drill into where the issue started and even the values that the object is holding.
Allocate the Time for Analysis
I must warn you, the analysis of the memory profile can be very time consuming. Make sure this is accounted for this time in the schedule. Also, make sure that the team lead or someone that knows a lot about how memory and performance work in .NET does the analysis. I can’t stress enough how important this is before going into production.
Discover more from dotNetTips.com
Subscribe to get the latest posts sent to your email.
